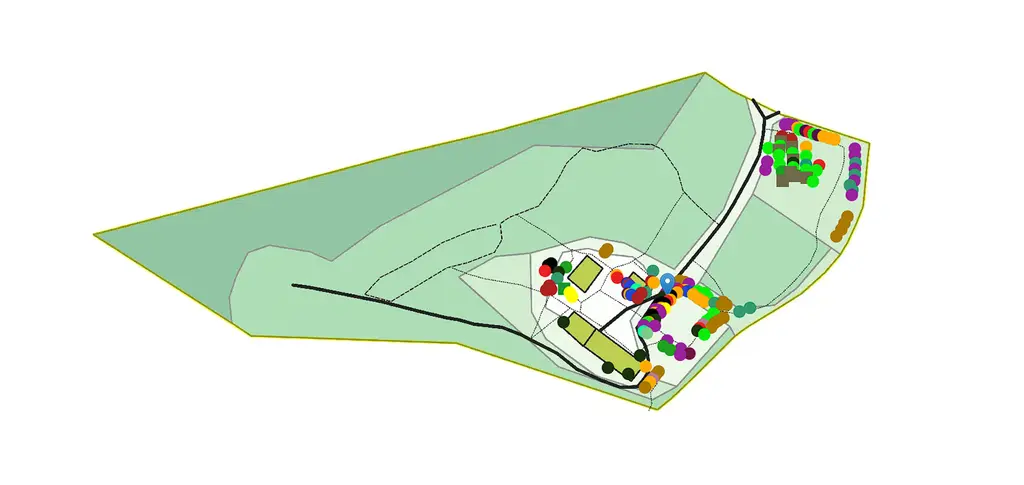
Several years ago, I developed a plant database for Beyond Buckthorns. While having a plant database is a wonderful asset in itself, the intrigue truly unfolds when this database is integrated with geospatial data – effectively constructing a digital counterpart of the physical terrain, or a "digital twin", of the site.
In this document, I will elucidate the process through which we designed the plant map at Beyondbuckthorns.com.
Vision
A map of all berry bushes and fruit / nut trees to be visible at Beyondbuckthorns.com. If possible also include mature perennials / herbaceous plants.
Earth care: Better distribution of resources. Understanding placement of plants, finding niches, adding layers.
People care: Same understanding of placement of elements for Lumia and me.
Fair share: the information to be publicly available. People can browse and check
Survey
Existing plant database
Some years back I wrote / coded the Beyond Buckthorns plant database. It was written by me in SQL using Libre Base (I had years of experience creating databases in MS Access) and stored on a cloud storage. I wrote it in order to keep track of the plants at Beyond Buckthorns.
The database is full of information. It lists the species, genus, trivial English name, trivial Finnish name, links for further reading, soil pH, and so on. It is huge, enormous, gigantic. :)
Export into different formats is possible. The most common one is CSV, the comma-separated value list.
The database is maintained by only me.
Base Map
For the “about page” at Beyondbuckthorns.com I created a base map. The base map in a software like Google Map or OpenStreetMap consists of tiles. Those tiles get loaded while zoomed in our out or while a map gets moved. This lowers the amount of data to be transferred.
In order to get a proper base map of Beyond Buckthorns for online usage I had to create tiles. Those tiles need to be tight to coordinates – longitude / latitude – otherwise the tiles will just show up somewhere but not on the specific coordinates.
GIS software
When we want to create maps we can either do this analogue, digital or a combination of both. For interactive maps we need software. The standard for software for map making is GIS, the graphical information system.
Let’s see some of GIS software on the market.
| GIS System | License | Entity/Organization Behind |
|---|---|---|
| QGIS | Open Source (GPLv2) | QGIS Development Team |
| ArcGIS | Proprietary | Esri (Environmental Systems Research Institute) |
| GRASS GIS | Open Source (GPLv2) | OSGeo (Open Source Geospatial Foundation) |
| MapInfo | Proprietary | Pitney Bowes |
| Global Mapper | Proprietary | Blue Marble Geographics |
All GIS software allows the export the geospatial data into different formats, like for example Shapefile, GeoJSON, KML, and CSV.
Website
If we want information to be publicly available it kind of makes sense to publish them at Beyondbuckthorns.com. Our website runs on Drupal, therefore I had to check which modules can be used.
| Module Name | Short Description |
|---|---|
| Geofield | Allows you to create fields to store geographic data (points, lines, polygons) in various formats (WKT, GeoJSON, etc.). Can be used for inputting and displaying geospatial data. |
| Leaflet | Integrates the Leaflet JavaScript library for mobile-friendly interactive maps. It can display map tiles, markers, and popups from various sources on a map. |
| Geocoder | Provides options to convert addresses and other location data into geographic coordinates (geocoding) and vice versa (reverse geocoding). It can support various geocoding providers. |
| OpenLayers | A powerful and flexible module integrating the OpenLayers library, which allows for complex mapping and GIS functionality by displaying data in layers. |
| Simple Google Maps | A simple module that provides an easy way to add a Google Map to display a single point with a simple text field for the address. |
| Geolocation Field | Allows you to create fields to store geographical locations as latitude and longitude. It supports different map widgets for user input, and it can display maps using Google Maps or Leaflet. |
| IP Geolocation Views & Maps | Provides mapping and geolocation functionality based on IP addresses. It can display the geographical location of visitors, content, and more. Supports integration with other mapping modules like Leaflet. |
Connection between GIS and Drupal
In order to get data from a GIS software into Drupal I need an importer. There are two options:
- Write a custom module
- Use the Feeds module
Analysis
The QGIS needs to be (Free) and Open Source Software. Anything else wouldn’t make any sense, or? We are permaculturists after all.
I have chosen QGIS as the GIS software because I’m already partially familiar with it, because it is Open Source and because help is just around the corner if needed.
On the Drupal site I opted for the Feeds module as it is pretty straight forward. It is extremely flexible and can be extended with other modules.
The base map is incorrect when it comes to the precise placement of trees and bushes. It doesn’t suffice.
The plant database will work as a resource for QGIS. Import is possible and it can be joint with the attribution table.
SWOC
Let’s see if creating an online plant map and list actually makes sense
| Strength Software development skills Know my way around software fast Already existing partials, like the Plant database and the website | Weakness Too many other interests Time is scare |
| Opportunities Showing the plantings online could attract new visitors It can serve as a research project for different Universities Possibly enhance knowledge Supports the conservation effort Facility research management | Challenges
|
Design
In the beginning of the design phase I step through Holmgren’s principles to see if I’m on track
- Observe and Interact: Lumia and I had trouble to communicate planting. With a common map this will work
- Obtain a yield: -
- Catch and store energy: We only need to do this once and then just update.
- Apply self regulation and accept feedback: the failures of placement and improper use of microclimates will be history
- Use and value renewable resources & services: Open Source!
- Produce no waste: Data is no waste. The data in GIS can now be analysed and used for calculations, etc.
- Design from patterns to details: I now have the different parts, the software, and now I have to see how it can be done – the details
- Integrate rather than segregate: The system will have multiple layers and since it will be open to the public we hope to get some feedback
- Use small and slow solution: -
- Use and value diversity: by choosing Open Software
- Use edges and value the marginal: I haven’t seen any interactive plant map. I guess we are the first ones to release such a map for their project.
- Creatively use and respond to change: -
The combination of software is simple: I’m going to use the existing Plant database, combine it with the layers in QGIS and then create a CSV file which I can import via Feeds into Beyondbuckthorns.com
Implementation
All theory is gray when it comes to reality. There is work ahead:
| Learn QGIS |
| Export Plant database and import into QGIS and clean data if necessary |
| Import geospatial layers from Karttapaikka |
| Create Zone layer in QGIS |
| Map existing fruit and nut trees and berry bushes |
| Combine geospatial data from QGIS with the imported Plant database |
| Export QGIS layers |
| Create Entity and Bundle within Beyondbuckthorns.com |
| Configure Feeds Module to map data from QGIS export into the Plant Entity / Bundle |
| Create new base map tiles using the Zone layer exported from QGIS |
| Make Drupal views map layer to use the newly base map tiles |
| Create plant map & list |
| Make map & list filterable |
| Create colour icons for the different species |
| Create the documentation |
Maintenance
The website has its own maintenance plan. In order to not create to much overhead we update the website’s plant map / list twice a year.
In QGIS we add the plants straight after planting.
Evaluation
Software usage
| What | Plus | Minus | Intersting |
| QGIS | It was actually easy | Sometimes stuff is hidden and not that obvious | |
| Drupal & Feeds | Straight forward
| Option to overwrite required fields only available via patch | |
| Plant Database | Lots of data Format easy to handle | Some essential columns still missing, needs more work |
Against the vision
So far the outcome looks exactly as I have envisioned it. It is an interactive map of fruit & nut trees and berry bushes. I haven’t done the perennial part yet – but it is on my list.
The process
For me it was straight forward. I got all of it done within 1 1/2 weeks. I have of course relied on already existing data. Whether the outcome is appreciated will be reflected in the visitors numbers and the amount of questions, links, etc.
Against Earth care, people care, fair share
While the people care and fair share part is well implemented the earth care part has still to be shown. It probably would have been enough for me to just have the QGIS map without the online implementation. On the other hand inspiring people to get back to their garden and plant some more bushes and trees might be just the derived earth care coming from the online map.
It is also to note that for the people care part the QGIS map might have been enough.
Tweak
I added a list of plants and integrated a count. It automatically counts the number of plant for a given species. I also updated the website to handle cultivars / varieties.
Reflection
During the 2023 PDC Tuomas and Roosa showed us their farm in QGIS. I was back on fire. After the PDC I finished the QGIS course and started to map all the fruit / nut trees and berry bushes. Thanks to them for giving me a kick!
The best part was actually learning QGIS. I haven’t been in a course for some time and I enjoyed it learning something partially new.
The worst was that I forgot some columns in the original Plant database and had to work my way around it.
I probably would change the colour coding of the plants.


